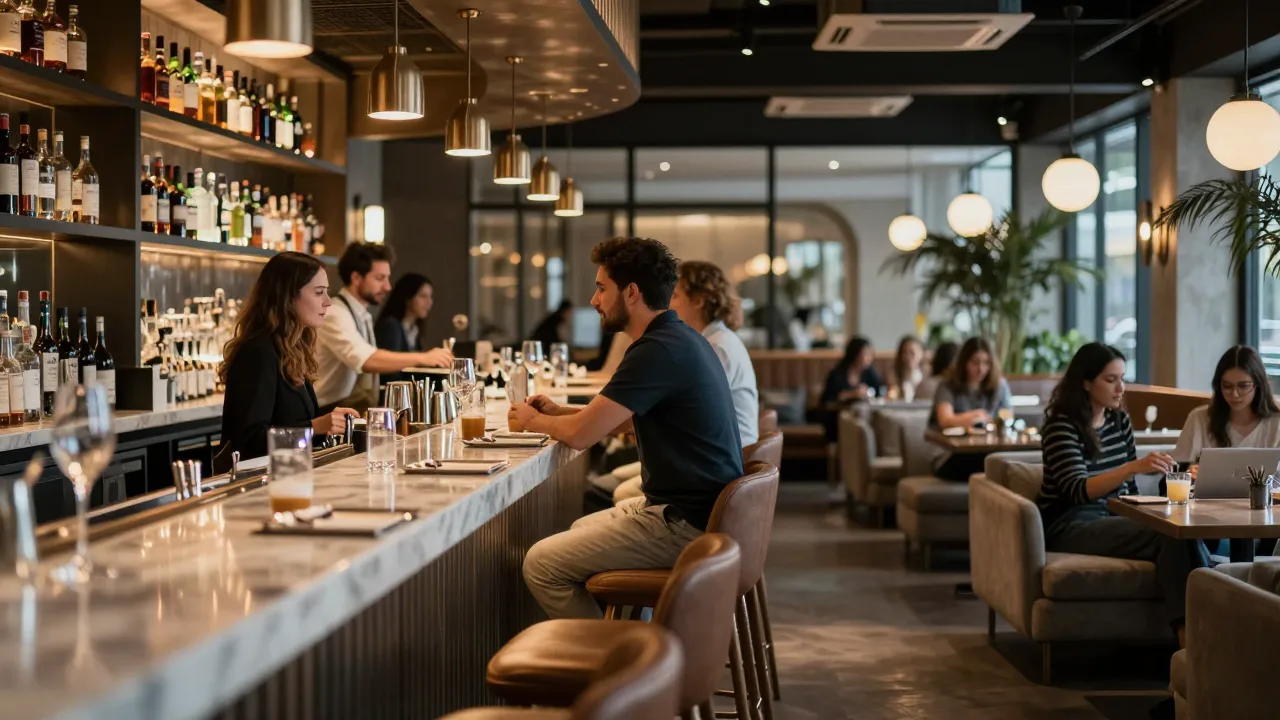
There is a 220-square-foot corner of your bar area filled with low armchairs and a coffee table. It looks like the photograph that sold the concept. On a Friday night it holds eleven guests, two of whom nurse a single glass of wine for ninety minutes while a party of four waits at the door for a rail seat that never opens.
That corner is not a design problem. It is a balance-sheet problem, and it compounds every single service. Square footage is the one input you cannot buy more of — you are paying rent, HVAC, insurance, and cleaning on every foot of it whether it earns or not. When a fifth of your bar area returns a third of what the rest returns, the difference does not show up as a loss anywhere. It shows up as a ceiling on what the room can do.
So let us settle it with arithmetic rather than taste. Measure both seating types the same way — footprint, dwell, check, turns — and the right mix stops being a matter of opinion.
The Metric That Settles the Argument
Revenue per square foot is the only measure that puts rail and lounge on equal terms. Seat count flatters lounge areas because armchairs look substantial. Check average flatters them too, since a lounge guest often spends more per visit. But neither accounts for the space consumed or the time held, and those are exactly where the two diverge.
The calculation is straightforward: seats in the zone × average check for that seat type × turns per service, divided by the zone's square footage. Run it separately for every seating type on your floor and you get a ranked list of which square feet are working. If you want the full methodology and how it applies across the whole dining room, this breakdown of restaurant revenue per square foot walks through the complete formula.
What Each Seat Type Actually Occupies
Start with the footprint, because this is where most of the gap comes from — and where most operators guess badly.
A bar rail seat needs 24 to 26 inches of rail width and 30 to 36 inches of clear circulation behind the stool. Two feet of width by four feet of depth is about 8 square feet of total floor area per seat, and half of that depth is shared circulation the room needed anyway.
A lounge seat is a different animal. An armchair is 30 to 34 inches wide, needs 18 inches of clearance to its neighbor, a shared low table, and a path in and out. Real-world lounge groupings land at 18 to 22 square feet per seat — between two and three times the rail footprint for the same one guest.
| Seat type | Sq ft / seat | Avg check | Dwell | Turns / 5-hr service | Revenue / sq ft |
|---|---|---|---|---|---|
| Bar rail | 8 | $34 | 55 min | 3.8 | $16.15 |
| Bar high-top | 12 | $38 | 68 min | 3.4 | $10.77 |
| Booth / banquette | 14 | $44 | 78 min | 3.0 | $9.43 |
| Lounge seating | 20 | $41 | 95 min | 2.6 | $5.33 |
Look at what happens across the row. Lounge guests spend 21 percent more per head than rail guests — and still return a third of the revenue per square foot, because they occupy two and a half times the space for nearly twice as long. The check average was never the variable that mattered.
Lounge seating does not lose on spend. It loses on the two things nobody puts on a P&L: square feet and minutes.
Apply it to that 220-square-foot corner. As lounge, it holds 11 seats and returns about $1,170 per service. Converted to rail and high-tops, the same footprint holds 24 to 27 seats and returns roughly $3,100. That is a $1,900 nightly swing, or somewhere near $500,000 a year on a six-night operation — from one corner of one room.
Running the Numbers on Your Own Floor
Your figures will differ, and the exercise only takes an afternoon. Work through it in this order:
- Measure the zones, not the room. Tape-measure each seating area separately, including the circulation it consumes. A lounge that blocks a service path costs more than its own footprint.
- Pull checks by seat type, not by server. Your POS can filter by table or seat range. Tag rail seats, high-tops, and lounge positions distinctly so the average check per zone is real rather than assumed.
- Time the dwell. Use open-to-close timestamps from the POS across two typical weeks. Do not use your impression — lounge dwell is almost always longer than operators estimate, often by 20 minutes.
- Count actual turns, not theoretical ones. Divide service length by dwell plus reset, then discount for the dead time between parties. Most zones run 15 to 20 percent below the theoretical number.
- Rank every zone and mark the bottom two. Those are your candidates for conversion — but do not convert yet. Read the next section first.
Example scenario: Ember & Oak, Austin
Illustrative scenario — a composite example built to show how the numbers work. It does not describe a real business or customer.
Ember & Oak, a 140-seat modern American restaurant with a strong cocktail program, had a 260-square-foot lounge that seated 13 and a 16-stool bar rail that was full from 6:00 PM onward with a persistent wait.
Before: Lounge revenue of about $1,340 per Friday against $2,050 from the rail — $5.15 versus $16.02 per square foot. Rail waits of 25 to 40 minutes on weekends, with parties leaving rather than waiting.
Change: Converted 160 square feet of lounge into a 10-seat rail extension and two four-person high-tops, keeping a 100-square-foot lounge pocket with movable furniture for waiting parties and small groups.
After 90 days: The converted zone returned $13.60 per square foot, bar-area Friday revenue rose 41 percent, rail waits fell to 8 to 15 minutes, and the smaller lounge held 60 percent more waiting parties per night because the furniture could be reconfigured.
When Lounge Seating Wins Anyway
Now the counterweight, because converting every soft seat into a stool is a mistake with its own price tag. Lounge seating earns its square footage when it does a second job, and there are three second jobs worth paying for.
The first is holding waiting parties. A lounge that keeps a party in the building instead of walking out the door is generating revenue that gets credited to the dining room. If your lounge absorbs six parties a night who would otherwise leave, it is worth several hundred dollars a service that never appears in its own zone report — a dynamic covered in more depth in our bar seating management guide.
The second is dwell-driven beverage revenue. In a serious cocktail program, a 95-minute dwell is not waste — it is the third and fourth drink. If your lounge check average is climbing past $50 with a beverage mix above 70 percent, the longer occupancy is doing exactly what it should. A point-of-sale built around bar and tavern service workflows makes that mix visible per zone rather than per ticket.
The third is the room itself. Some dining rooms need soft seating to read as hospitable rather than industrial, and a room guests want to be in supports higher prices everywhere. That is a real return — just make sure you are buying it deliberately, at a known cost per square foot, instead of by default.
The Hybrid Layout That Usually Wins
In practice the strongest bar areas are not 100 percent rail or a fixed lounge suite. They are a 65/35 split of high-throughput seating to soft seating, with the soft portion built entirely from movable furniture.
Movable is the operative word. Lightweight lounge chairs and nesting tables can hold four waiting parties at 6:30, become a group of eight at 8:00, and clear entirely for a Thursday buyout. Fixed banquettes and heavy sectionals can only ever be one thing, which is why they so often sit half-empty — a trade-off worth weighing alongside the booth versus table decision in the main dining room.
Two layout details make the hybrid work. Keep the rail continuous rather than broken into segments, since interrupted rails lose two seats at every gap. And protect the circulation lane behind the stools at a full 36 inches; if you narrow it to 30 to squeeze in the lounge, service slows and rail spend drops. The same clearance logic that governs table spacing in the dining room applies with even less margin at the bar.
Mistakes That Distort the Comparison
- Counting seats instead of square feet. Eleven lounge seats and eleven rail seats are not comparable inventory. Always normalize by area.
- Using dining-room check averages for bar zones. Bar spend is beverage-weighted and behaves differently by hour. Pull it separately or the whole model is wrong.
- Ignoring circulation in the footprint. A lounge that eats a service path costs you more than its own square footage, in slower service everywhere around it.
- Converting the entire lounge. Losing your waitlist valve to gain eight stools often produces more walk-aways than covers, especially in a room with no lobby.
- Measuring once and never again. Zone economics shift with menu changes, price changes, and season. Re-run the numbers twice a year alongside your seating capacity review.
The Decision, in One Line
Rail seating is throughput; lounge seating is dwell. Rail wins on revenue per square foot by roughly three to one, so it should be the default for any bar footprint that is regularly full. Lounge earns its space only when it holds waiting parties, drives a beverage program with a genuinely higher mix, or makes the room work — and it should be movable enough to do all three. Measure both zones the same way, twice a year, and the mix corrects itself.
KwickOS tracks check average, dwell, and turns by seat and zone, so rail, high-top, lounge, and dining-room performance sit side by side in one report instead of being estimated from memory.
See Which Square Feet Actually Earn
KwickOS ties every check to a seat and a zone, so revenue per square foot for your rail, high-tops, and lounge is a report rather than a guess. Join 5,000+ restaurants and start free, no credit card needed.
Start Your Free TrialSell the Platform That Shows Operators Their Blind Spot
Zone-level revenue per square foot is the number most bars have never seen. KwickOS resellers earn recurring revenue on the all-in-one platform that ties the whole floor together.
Join the Reseller Program