Average Table Turn Time by Restaurant Type: 2026 Data Study
Why Benchmarking Table Turn Time Matters
You can't improve what you don't measure, and you can't set goals without benchmarks. We collected table turn data from 523 restaurants across 14 metropolitan areas in the US and Canada over Q4 2025 and Q1 2026. This dataset represents over 2.8 million individual table turns.
The results reveal enormous variation — even within the same restaurant category. The top quartile of casual dining restaurants turn tables 34% faster than the bottom quartile, translating to 8-12 more covers per night and $400-$700 in additional daily revenue.
The Numbers: Average Turn Times by Category
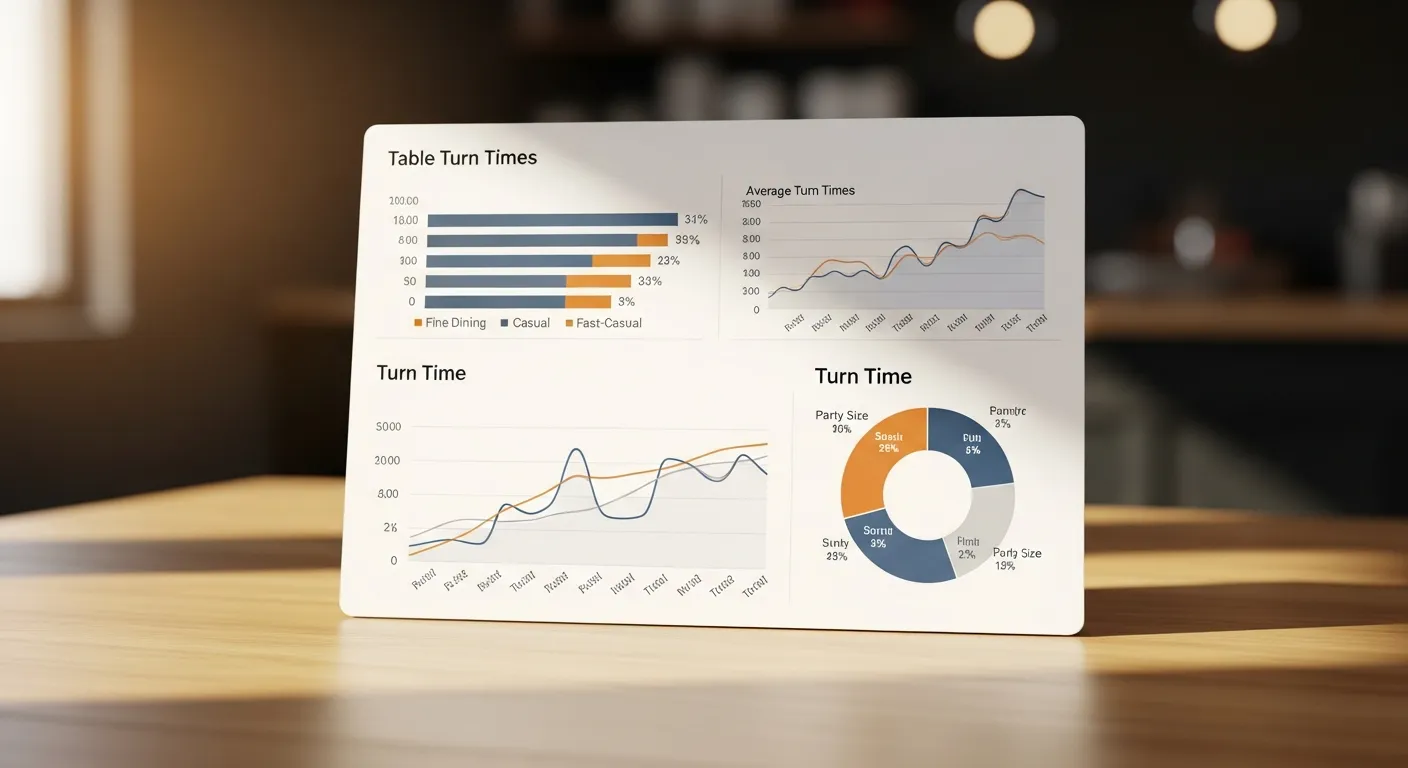
Fast casual: Average 28 minutes, range 18-42 minutes. The top performers use self-ordering kiosks or QR code ordering that eliminates server ordering time entirely. Bottom performers have long counter lines and slow kitchen throughput.
Casual dining (2-tops): Average 48 minutes, range 35-68 minutes. The 13-minute gap between average and top performers is almost entirely dead time — waiting for menus, waiting for the check, waiting for table reset. Casual dining (4-tops): Average 64 minutes, range 48-85 minutes. Larger parties add complexity in ordering, splitting checks, and coordinating departures.
Fine dining: Average 94 minutes, range 75-130 minutes. Turn time varies dramatically based on number of courses. A 3-course dinner averages 82 minutes; a 7-course tasting menu averages 118 minutes. Fine dining should optimize for per-person spend, not turn speed.
Day-of-Week and Time-of-Day Patterns
Weekday lunch turns are 22% faster than weekend dinner turns across all categories. This isn't surprising — lunch diners are often on a time constraint. The opportunity is in weekday dinner, which is 11% faster than weekend dinner but often has lower occupancy. Faster turns + empty tables = wasted potential.
Peak hours (6:30-8:30 PM) actually show slower turns than off-peak — counterintuitively. The culprit: kitchen bottlenecks. When every table orders simultaneously, food delivery slows, extending the gap between ordering and eating. Restaurants that stagger reservation times by 10-minute intervals avoid this kitchen pileup and maintain consistent turn times throughout the evening.
What Separates Top Performers
We identified five characteristics shared by restaurants in the top quartile of turn efficiency: they all use digital table management software (not paper reservation books), they pre-bus consistently (97% pre-bus rate vs 61% for bottom quartile), they have table reset times under 3 minutes, their POS is integrated with their table management system, and they measure and review turn data weekly.
Notably, top performers don't sacrifice guest satisfaction. Their average Yelp and Google ratings are 0.3 points higher than bottom-quartile restaurants. Faster turns through dead-time elimination actually correlate with better reviews — because guests spend less time waiting and more time enjoying.
How to Calculate Your Restaurant's Turn Time
Step 1: Pull your POS data for the last 30 days. For each table, calculate the time between first order and check close. This is your 'service time' — the part of the turn the guest experiences.
Step 2: Track reset time separately. Have a manager time 20 table resets across different shifts. Average this. Add service time + reset time + average seat-to-order time (typically 5-8 minutes) = total turn time.
Step 3: Compare to benchmarks above. If you're above average for your category, prioritize the dead-time elimination strategies. If you're below average, investigate kitchen throughput and staffing levels — you may have a speed problem, not a dead-time problem.
Ready to Upgrade Your Restaurant?
KwickOS: table management, waitlist, POS, online ordering — all in one platform. 5,000+ restaurants trust us.
Get a Free Demo →Become a KwickOS Reseller
Earn recurring revenue bringing KwickOS to restaurants in your area. Exclusive territories available.
Apply Now →